2A2G SunCity v0.1 · BetaES

NASA Space Apps Challenge 2026 · Team 2A2G

All the heat starts here

150 million km later, it reaches our streets.

NASA Space Apps Challenge 2026 · Be an Earth System Trend Detective

Reading the heat of desert cities

We use open NASA data to see what is changing in the climate, by how much, and whether the change is real or just chance.

Scroll: from the Sun to Hermosillo
01/06Cover

SUNCITY

We detect where the city burns.

NASA Space Apps Challenge 2026 Challenge: Be an Earth System Trend Detective
Team 2A2G
    02/06The problem
    Heat alert · Sonora

    Heat is already news

    Hermosillo tops 45 °C in summer, and the heat is not spread evenly across the city.

    Why we chose it

    We live here. We feel it every summer.

    • El Imparcial

      Calor extremo en 2025 causó 77 muertes en todo México, Sonora fue el estado más afectado

      Extreme heat in 2025 caused 77 deaths across Mexico; Sonora was the hardest-hit state

      Read story (opens in a new tab)
    • El Imparcial

      Hermosillo rompe récord de temperatura con 49.5° C para un 12 de junio

      Hermosillo breaks the temperature record for June 12 with 49.5 °C

      Read story (opens in a new tab)
    • El Imparcial

      Sonora con más muertes por calor en México; van nueve decesos

      Sonora has the most heat deaths in Mexico; nine so far

      Read story (opens in a new tab)
    • El Imparcial

      Sonora lidera en casos de afectaciones por calor: 254 reportes y 10 defunciones en el año

      Sonora leads in heat-related cases: 254 reports and 10 deaths this year

      Read story (opens in a new tab)
    • N+

      Se rompe récord de alta temperatura para un 28 de julio en Hermosillo

      High-temperature record broken for July 28 in Hermosillo

      Read story (opens in a new tab)

    What is changing in our climate, by how much, and where in the city?
    03/06The solution

    Urban climate intelligence

    SunCity tells you whether a place’s climate is really changing, by how much, and how sure we are.

    Historical map

    Anywhere on the planet, with 45 years of NASA data.

    Trend detection

    How much it changes every 10 years, and whether the change is real.

    Know where to look first

    In Hermosillo, at night, sector by sector.

    HermosilloWorks anywhere
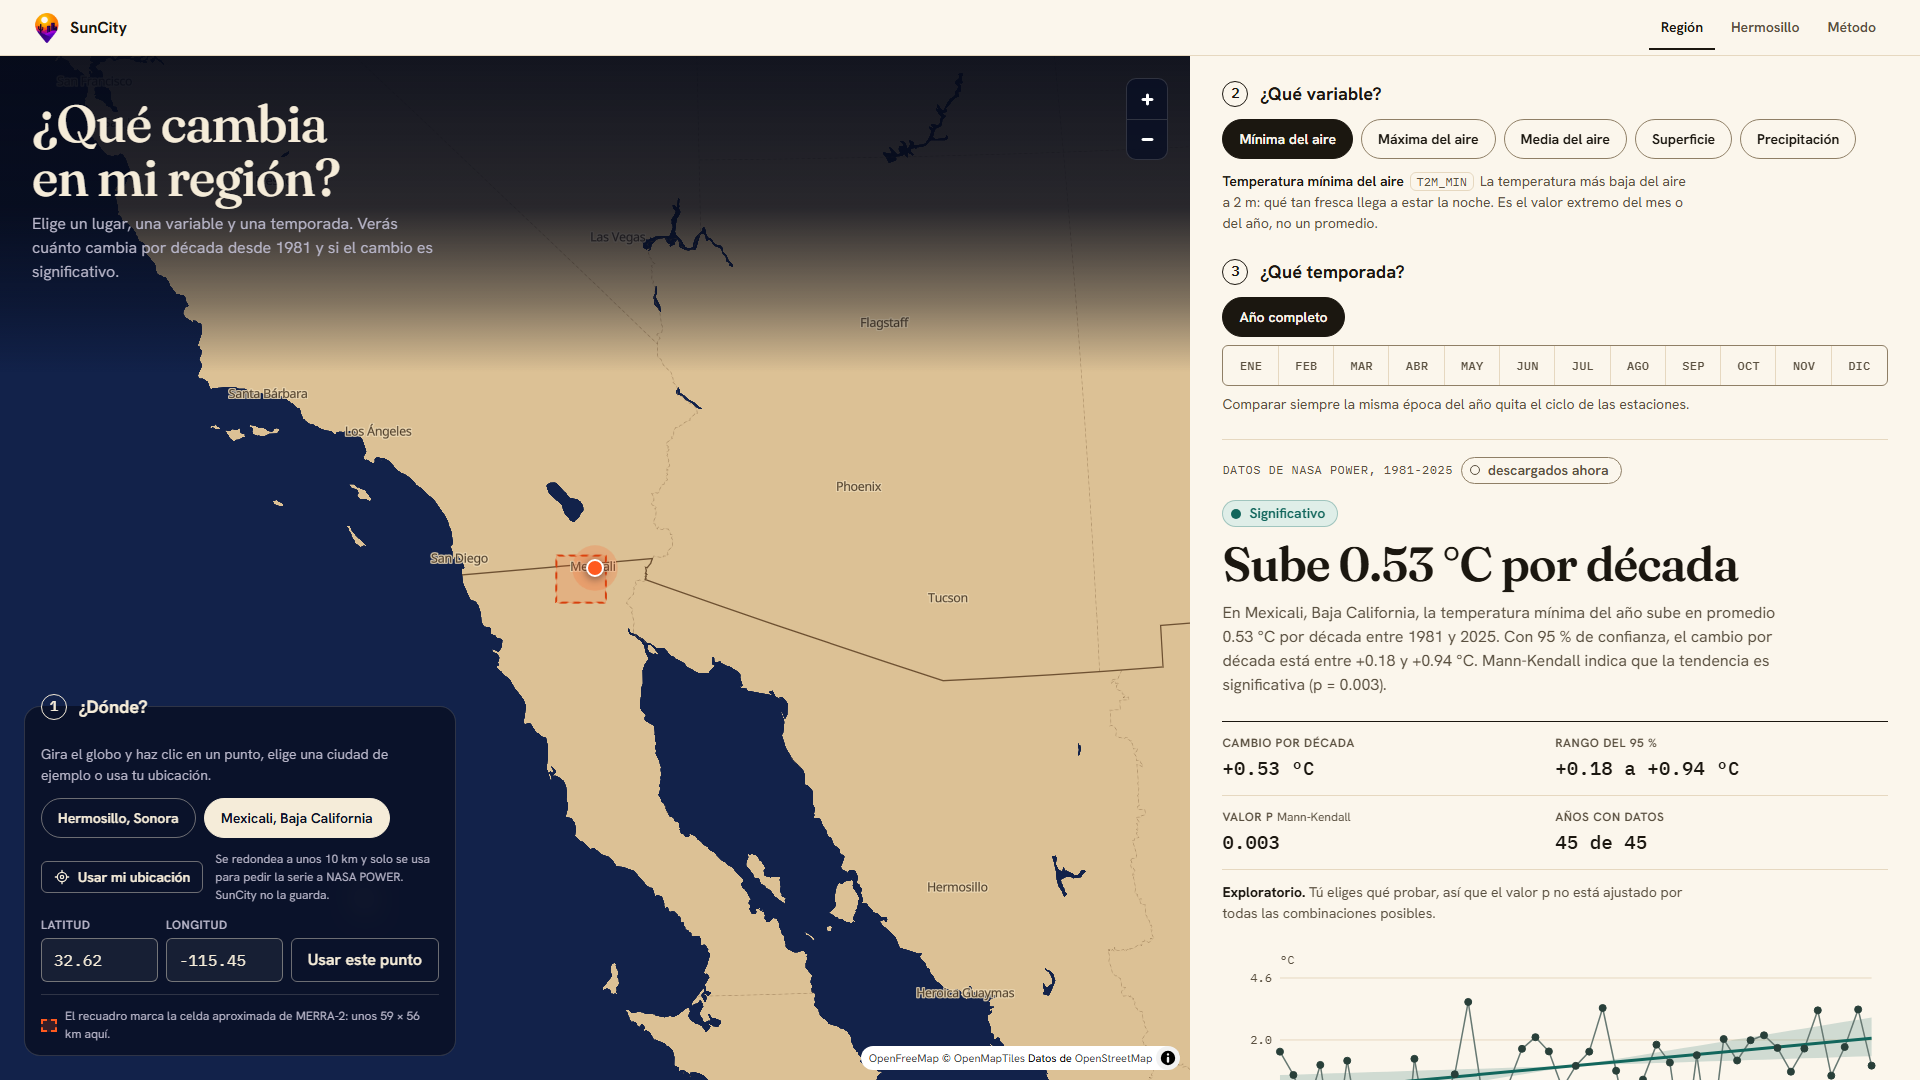
    Mexicali+0.53 °Cevery 10 yearsREAL
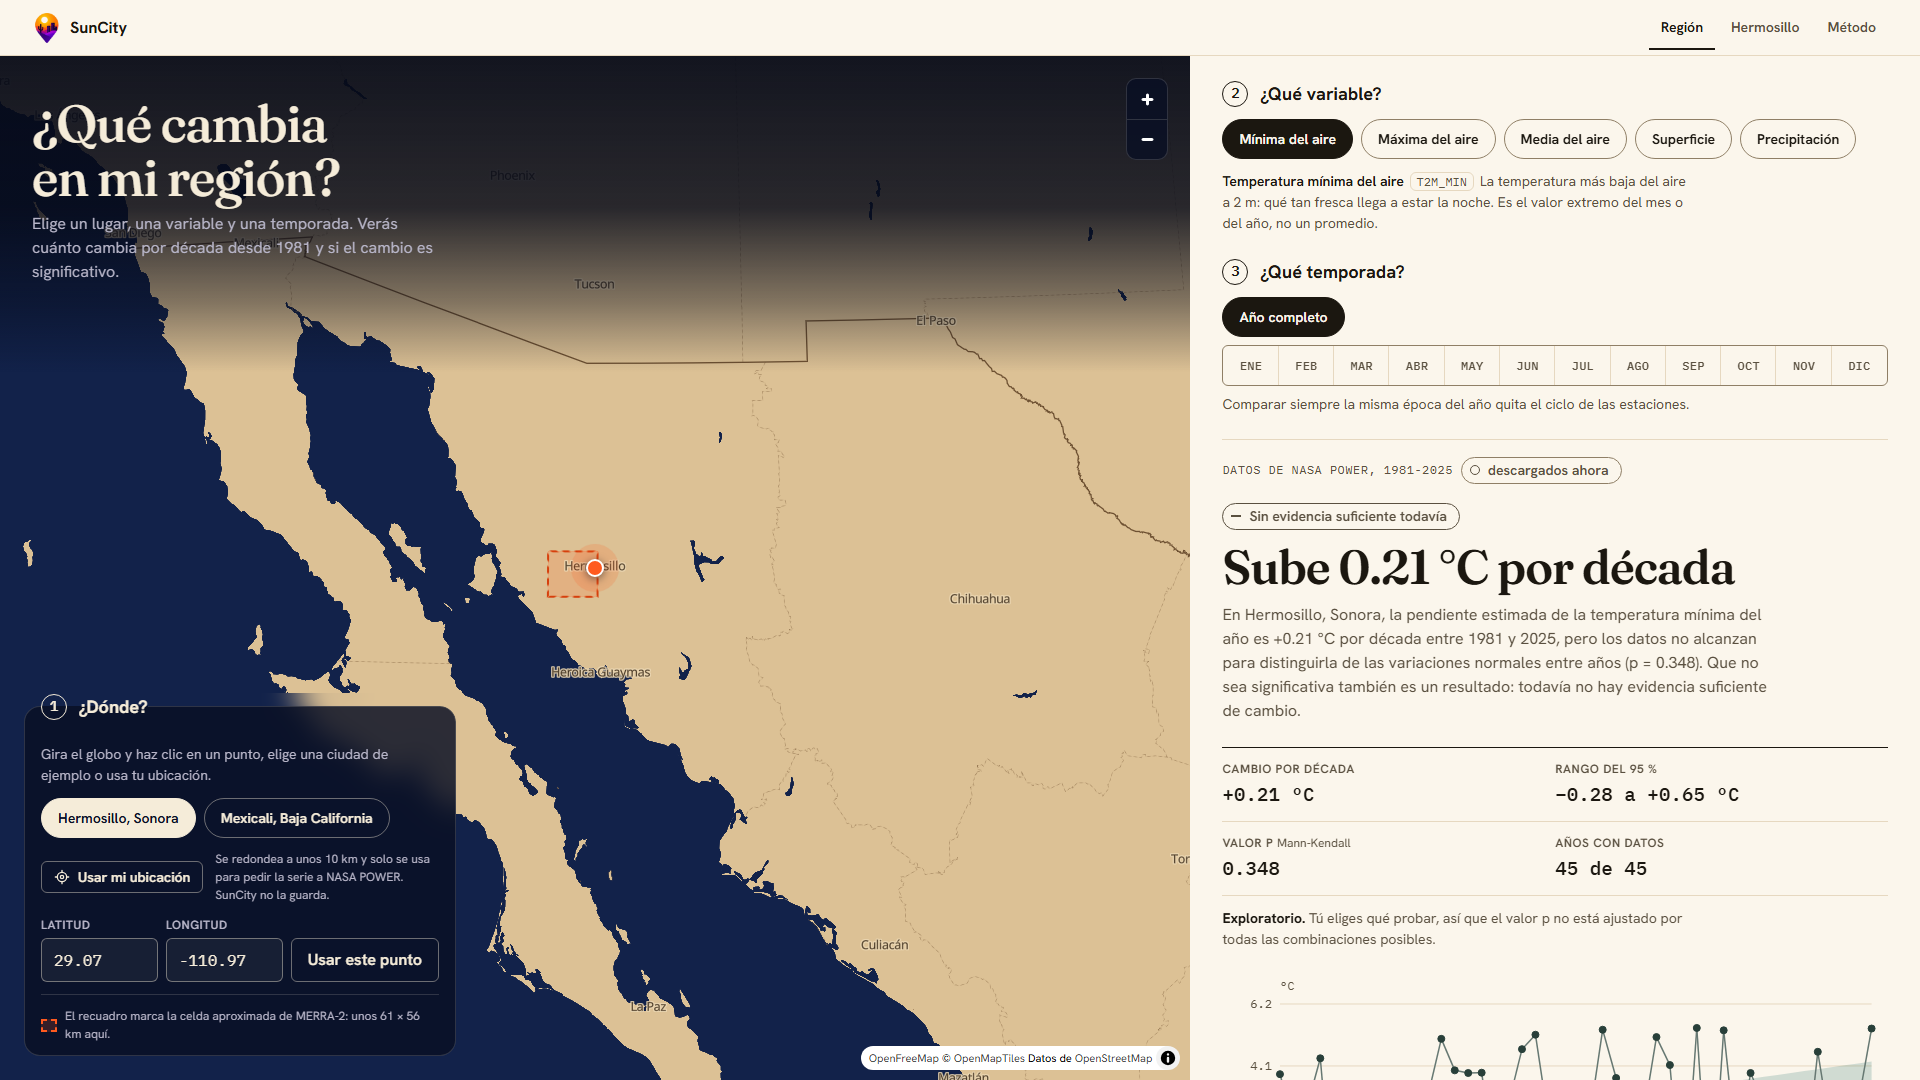
    Hermosillo+0.21 °Cevery 10 yearsNOT ENOUGH EVIDENCE YET

    Source: SunCity, NASA POWER 1981–2025

    04/06How it works and data

    From satellite to answer

    1. 01

      Gather the data

      Years of NASA measurements for your region or for each sector of Hermosillo.

    2. 02

      See the trend

      We calculate how much the temperature rises or falls every 10 years.

    3. 03

      Check that it is real

      We check the change is not just chance and show it with a traffic light. The rules were written before calculating.

      Heating upCooling downNot enough evidence

    NASA POWER

    45 years of climate · 1981–2025

    MODIS · Terra and Aqua satellites

    Ground temperature at night · 2001–2019

    ECOSTRESS · International Space Station

    70 m detail · 70 m

    All of it is open and free data.

    Technical details
    • How much it changes: Theil-Sen slope, in degrees per decade.
    • Whether it is real: Mann-Kendall test on the yearly series.
    • Margin: 95 % range around the slope.
    • Many sectors at once: FDR correction across sectors, to avoid false alarms.
    • Rules: thresholds and criteria are recorded before calculating.
    05/06How it is used

    Your place, at a glance

    suncity.2a2gcompany.com/via-a
    Real SunCity screenshot: Mexicali, result and chart
    Region: pick any place on the planet
    suncity.2a2gcompany.com/via-a
    Real SunCity screenshot: Hermosillo, result and chart
    The same calculation, in Hermosillo
    suncity.2a2gcompany.com/via-b
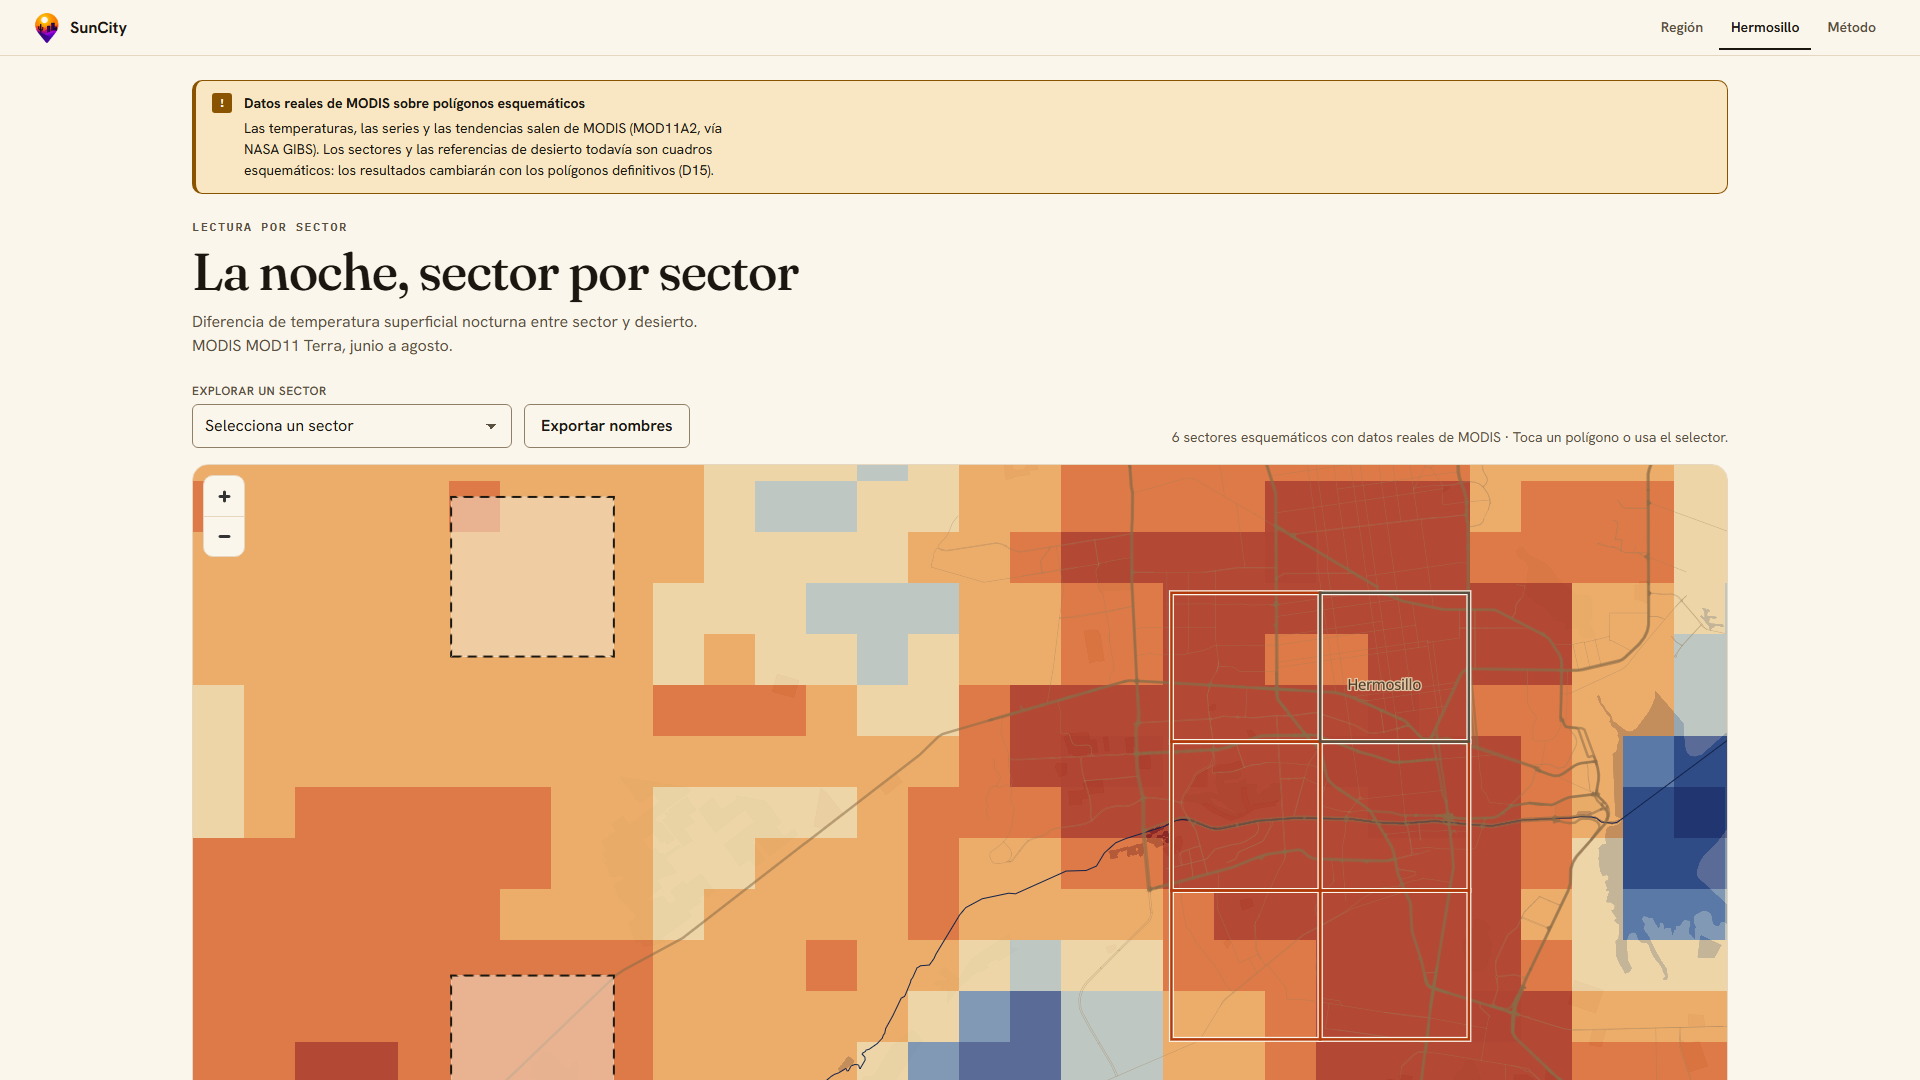
    Real SunCity screenshot: Hermosillo by sector
    Hermosillo by sector (test data for now)
    1. 1

      Pick your place

      A point on the map or a sector of Hermosillo.

    2. 2

      See its history

      45 years of your region, or your sector’s nights.

    3. 3

      Read the result

      How much it changes every 10 years, with what margin, and whether it is real.

    4. 4

      Take it to the table

      A clear answer for neighbors, schools and city planners.

    Hermosillo’s zones still use test data.

    06/06The vision

    We start at home. We scale across the desert.

    1. Today

      Any region on the planet

      It already works: trends from NASA data, right in the browser.

    2. Phase 1

      Hermosillo with real data

      Move the zones from test data to real measurements.

    3. Phase 2

      More desert cities

      The same way of measuring, city by city.

    Know where
    to look first.

    SunCity shows where to look. The action is human.

    Join the mission